Your StoreAgent dashboard just got a major upgrade, and it’s live now. The page you land on when you open StoreAgent is no longer a plain list of notifications. It’s a full operational overview of how your AI chatbot is performing, how much it’s earning you, and where shoppers drop off before they buy.
Until now, the dashboard could tell you what needed your attention, but not how your store was actually doing. You couldn’t see at a glance whether the AI was making you money this week compared to last, how many chats turned into purchases, or how close you were to your plan’s credit limit. You had to go hunting for all of it.
That changes with this release. In this article, we’ll explain what’s new and what’s included, then show you everything you can do with it. So, let’s get started!
Table of Contents
What’s New In The StoreAgent Dashboard?
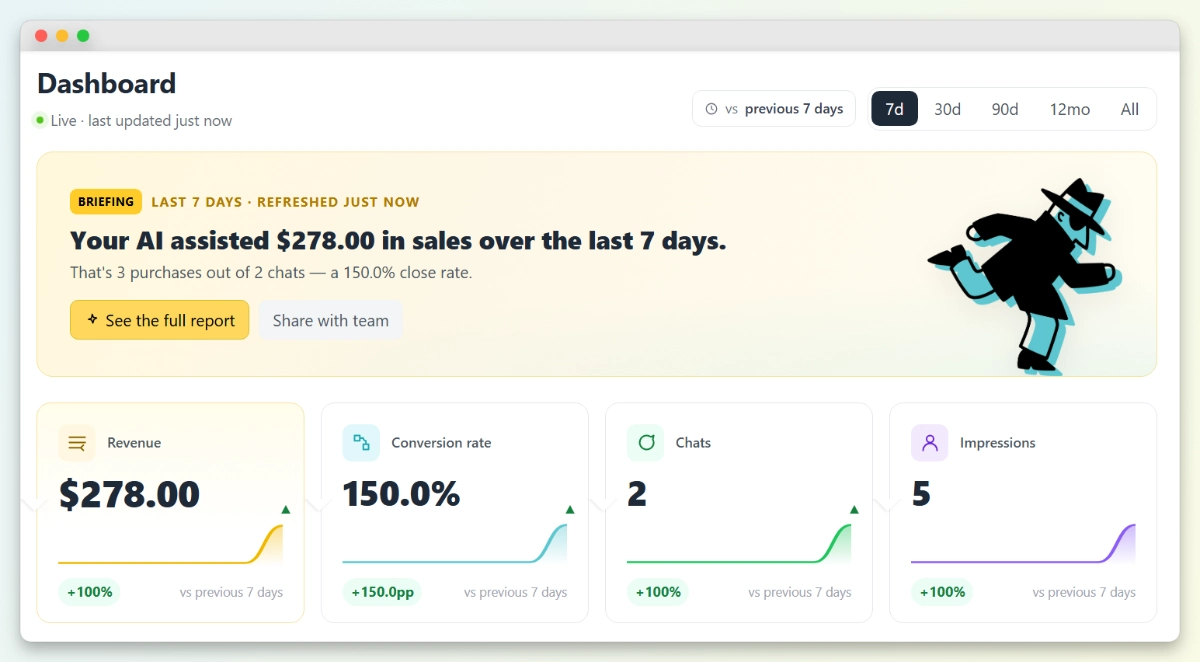
The new StoreAgent dashboard turns a notifications-only screen into a single overview of your store’s AI performance. The moment you open it, you see a plain-language briefing, four KPI cards, a conversion funnel, and your pending decisions, all on one page.
Here’s what’s included in the redesign:
- A credit meter in the header: your plan and used-versus-total credits with a progress bar, so you always know where you stand.
- A date range control: switch between 7d, 30d, 90d, 12mo, and All, with a “vs previous period” chip that names what you’re comparing against.
- A personalized briefing: a short, readable summary of how your AI chatbot is doing.
- Four KPI cards: Revenue, Conversion rate, Chats, and Impressions, each with a sparkline and a period-over-period change.
- A conversion funnel: hover any KPI to see where shoppers fall away on the path to purchase.
- A pending decisions center: a refreshed action list of items your AI agents need you to approve.
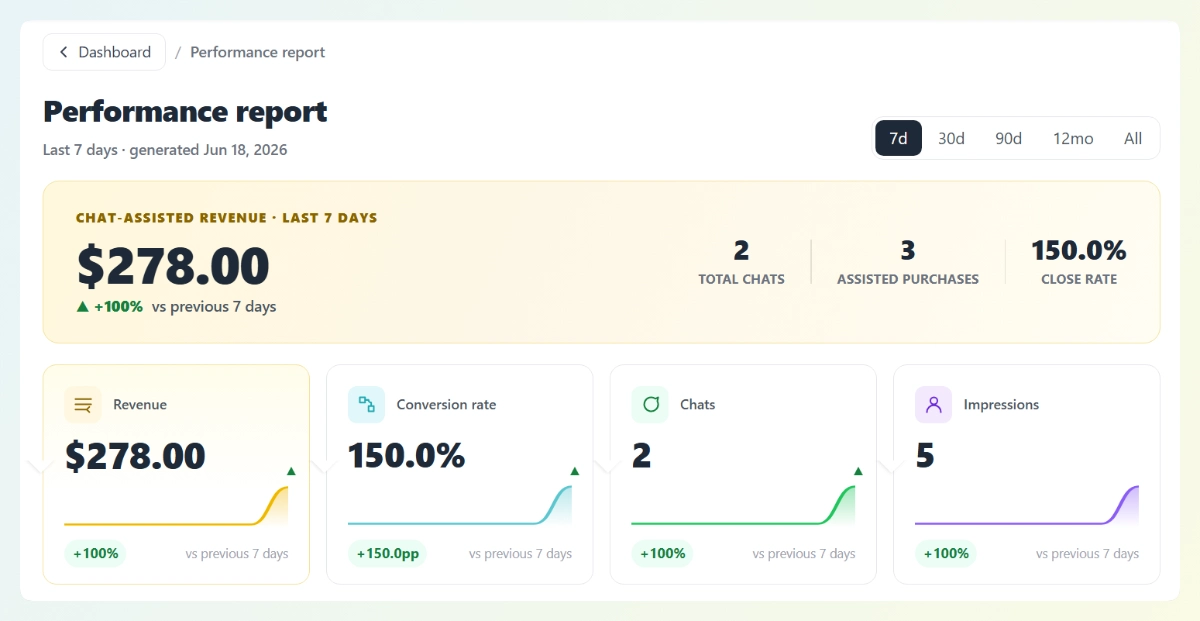
- A full Performance report: a standalone page for deeper analysis, plus one-click team sharing.
Why Did We Redesign The Dashboard?
We rebuilt it because the old dashboard answered the wrong question. It told you what needed your attention, but not whether StoreAgent was working for your store. Those are two different things, and store owners kept asking us for the second one.
Knowing where the funnel leaks matters more than it sounds. According to Baymard Institute’s research, the average online shopping cart abandonment rate sits at 70.22%, calculated across 50 separate studies. Most shoppers who start a journey don’t finish it, and now you can see the exact step where yours stop.
What Can You Do With Your New Dashboard?
Everything sits on one page, and you can dip into whichever part you need. Here’s what’s at your fingertips.
Set your date range

The “vs previous period” chip tells you exactly what each comparison is measured against, and every section updates together when you change it.
Read your performance in one line
The briefing is a one-sentence summary of your AI’s impact, written in plain English instead of raw numbers.
It reads something like: “Your AI assisted [amount] in sales over the last 30 days. That’s [X] purchases out of [Y] chats, a [Z]% close rate.” Pretty handy, right?
Track four KPIs at a glance
The four KPI cards show Revenue, Conversion rate, Chats, and Impressions, each with a sparkline and how it’s changed versus the previous period. They draw on real data, because StoreAgent now tracks widget impressions and chat-to-cart events on the server for the first time.

If you want to go deeper on which numbers matter most, learn which chatbot KPIs every WooCommerce store should track.
Reveal where shoppers drop off
Hover over any KPI card and the conversion funnel appears beneath it, with that metric’s stage highlighted.
The funnel maps the full path your shoppers take: Saw the widget → Opened the chat → Added to cart → Purchased.
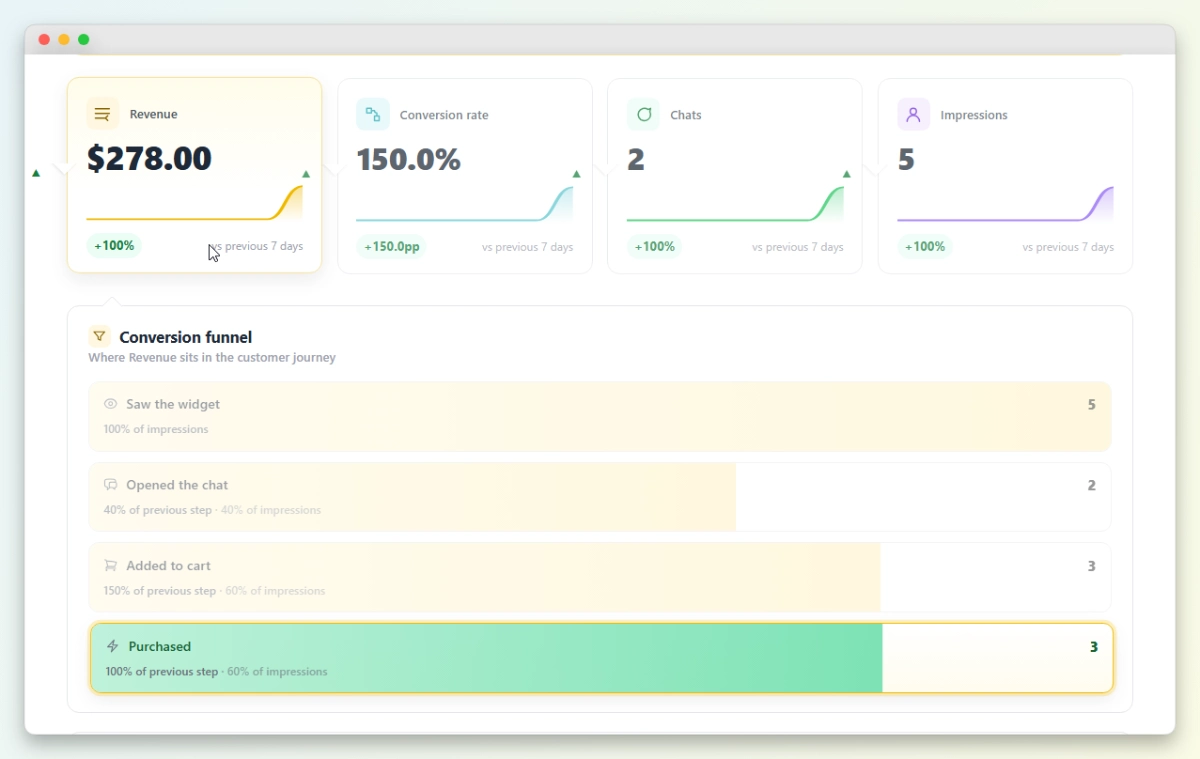
Each step shows its count plus two percentages: the share of the previous step it kept, and its share of total impressions. That’s how you spot the exact point where customers slip away, like seeing the widget but never opening the chat.
💡 Seeing a big drop there? You can see how an AI chatbot helps reduce cart abandonment at that stage.
Open the full Performance report
Click See the full report in the briefing to open a dedicated Performance report page, with a breadcrumb back to your dashboard.
It has its own date filter and opens with a summary band: chat-assisted revenue, total chats, assisted purchases, and your close rate side by side, followed by the KPI cards and funnel.
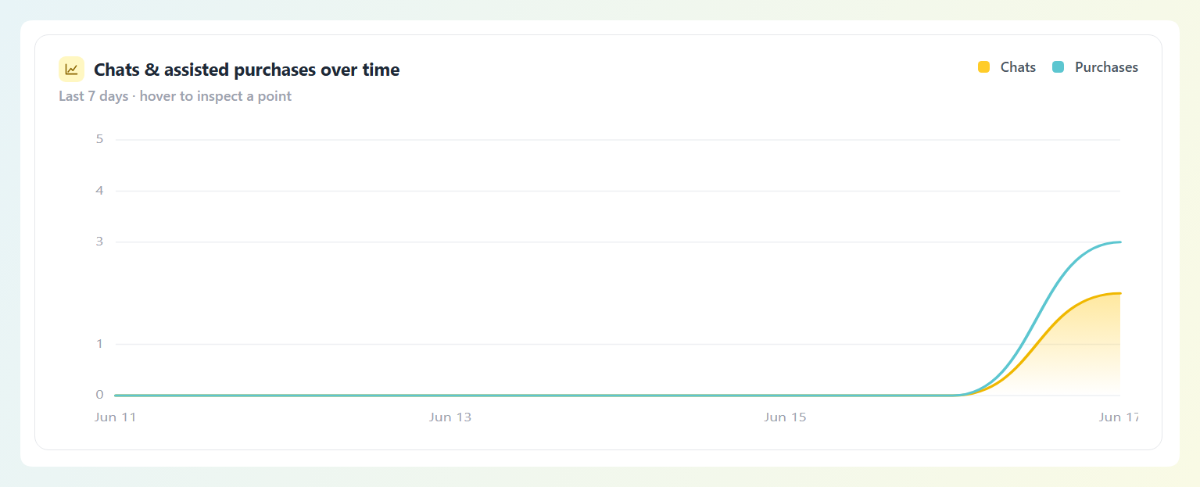
The report also adds a Chats & assisted purchases over time chart. Hover any point on the line and a tooltip shows the exact chats and purchases for that day, so you can see whether your AI chatbot’s impact is trending up week over week.
Review and approve pending decisions
Pending decisions and updates is your AI action center, with a count badge showing how many items need your attention.
Each card names the agent that raised it and gives you the context to decide quickly: a flagged review shows the rating, the review text, a confidence score, the reasons, and a short AI summary, with Accept and Reject right there. A content suggestion like “Main description is too short” gives you an Expand with AI action in one click.
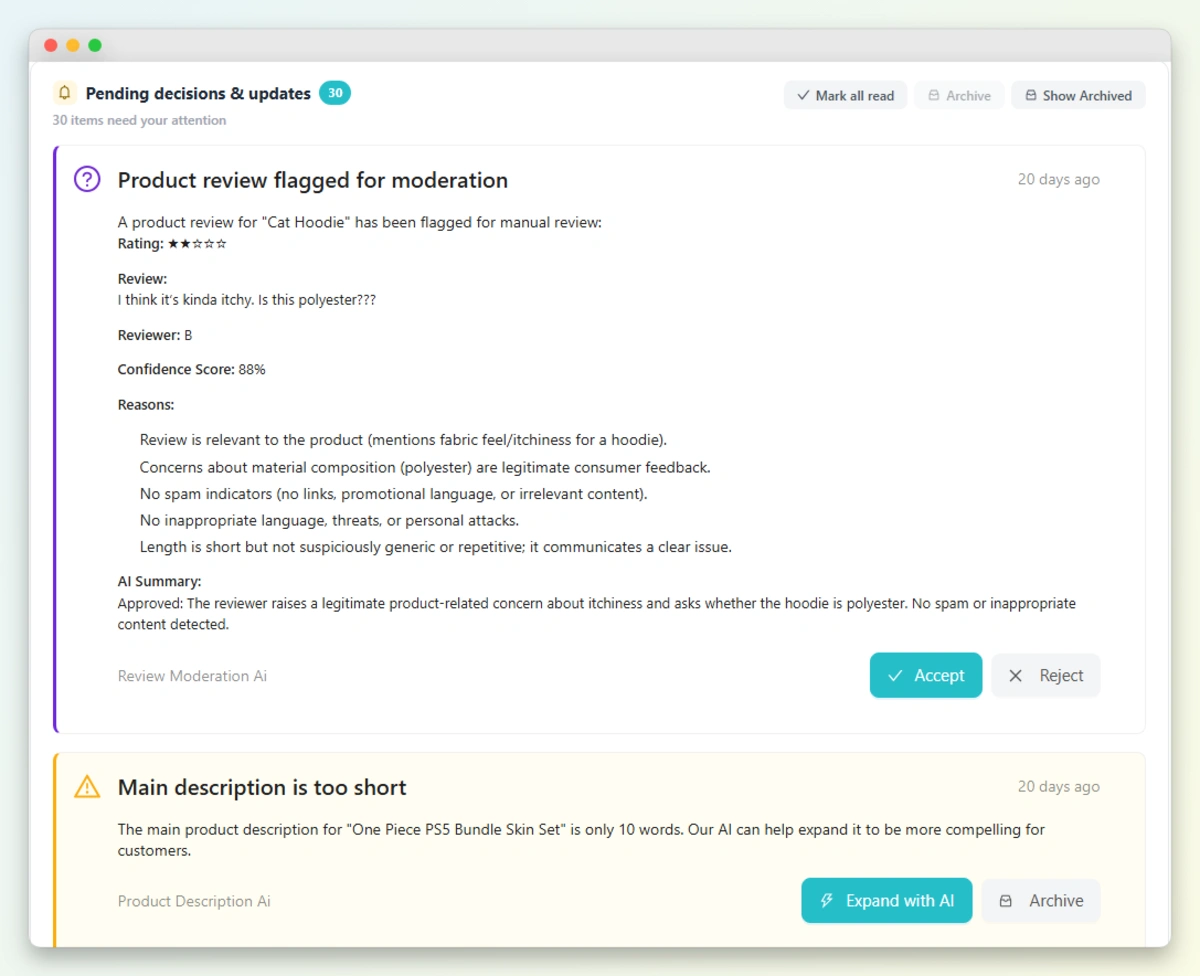
Nothing happens until you say so. This is where agents like the automatic product review moderation agent surface their work, so you can approve it in a click instead of digging through your store.
Share with your team
The briefing’s Share with team button opens a dedicated sharing flow, not a copy-the-URL shortcut.

If you work with a partner, a VA, or an agency, you can hand them a view of how your AI chatbot is doing without giving them the keys to your whole WordPress admin.
What Do New Users See First?
New to StoreAgent? Instead of an empty screen, the dashboard greets you with a guided setup.
A “Welcome to StoreAgent” hero tells you your AI sidekick is ready, with a Start setup button and a Take the tour option that runs about five minutes.
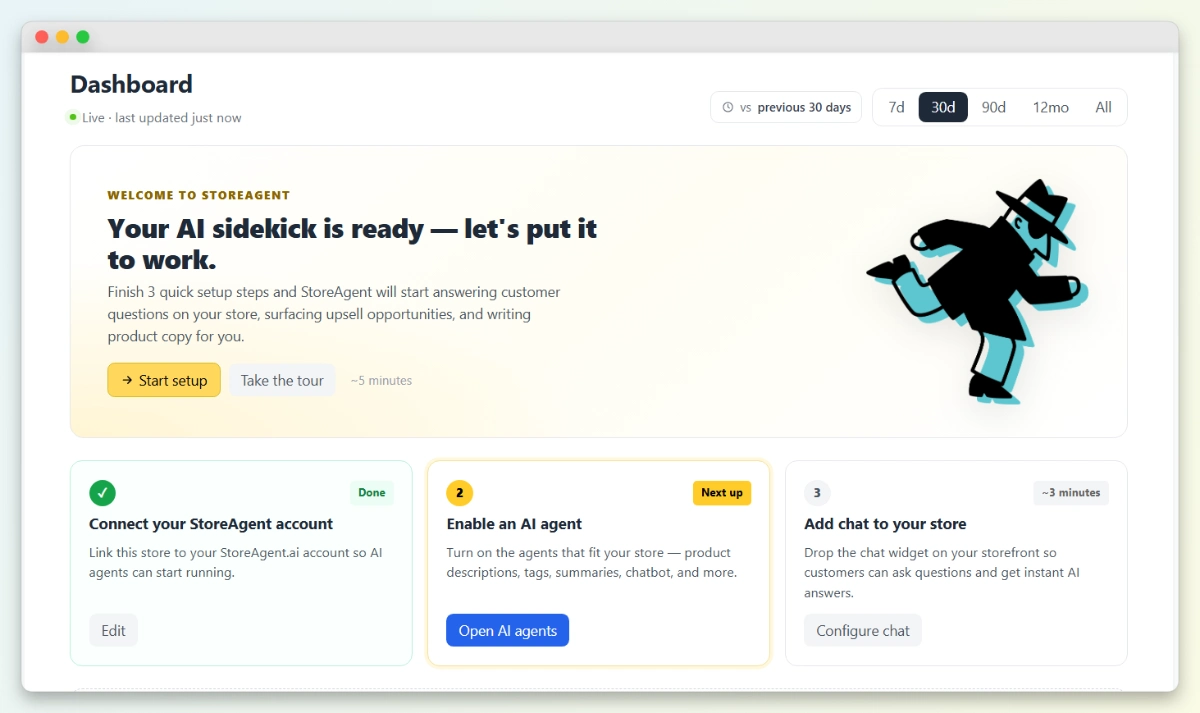
Three setup cards walk you through getting started, with the step you’re on highlighted.
You connect your StoreAgent account, enable an AI agent that fits your store (from product descriptions and tags to the chatbot, including tools that surface upsell and cross-sell opportunities), and add the chat widget to your storefront so customers get instant AI answers.
What Else Is New In This Release?
Alongside the dashboard, this release brings a faster first-time setup (your onboarding memory upload now kicks off right away instead of waiting), a smoother setup wizard, and a batch of bug fixes across onboarding, feedback settings, and the AI memory exclude list.
None of these change how your chatbot behaves on your storefront. They just make StoreAgent quicker and smoother to run.
Get Started
The redesigned dashboard puts your store’s AI performance where it belongs: on the first screen you see, in plain language, with the detail one click away. Here’s a quick recap of what we covered:
- A plain-English briefing of your AI-assisted sales and close rate
- Four KPI cards with sparklines and period-over-period comparisons
- A hover-to-reveal conversion funnel that shows where shoppers drop off
- A standalone Performance report with its own date filter and an over-time chart
- One-click team sharing and a pending decisions action center
- A guided first-run experience for new stores
To get it, update StoreAgent and open your dashboard. If you’re not using StoreAgent yet and you’re ready to see what your own StoreAgent dashboard would tell you about your store, explore our plans and pricing today.
Frequently Asked Questions
Do I need to set anything up to get the new StoreAgent dashboard?
No. Update StoreAgent to the latest version and open it in your WordPress admin. The redesigned StoreAgent dashboard loads automatically, and your KPIs and funnel populate as your store gathers chat data.
Will the redesign change how my AI chatbot works on my store?
No. This update changes the admin dashboard only. It doesn’t touch how your AI chatbot behaves, how billing works, or how the chat widget renders on your storefront. Your shoppers won’t see any difference.
What does the conversion funnel show?
It maps the path from a shopper seeing your chat widget to opening the chat, adding to cart, and purchasing. Each step shows how many people reached it, the share of the previous step it kept, and its share of impressions, so you can spot exactly where customers drop off.
What’s in the full Performance report?
The Performance report has its own date filter (7d, 30d, 90d, 12mo, All), a summary of chat-assisted revenue with total chats, assisted purchases, and close rate, the KPI cards, the conversion funnel, and a “Chats and assisted purchases over time” chart you can hover to inspect any single day.
Can I share my StoreAgent dashboard with my team?
Yes. The briefing has a “Share with team” button that opens a dedicated sharing flow, so you can give a partner, VA, or agency a view of your AI performance without handing over full admin access.
Which plans include the new dashboard?
Everyone. The redesigned dashboard is a UI improvement to your StoreAgent admin, so every plan gets it, including the free Lite plan. There’s nothing to unlock and no tier to upgrade to. Your KPIs and funnel simply fill in from your store’s chat activity.