A chatbot analytics dashboard is how you find out whether your AI chatbot is actually helping your store, or just answering questions into the void. It turns raw chat logs into numbers you can act on: how many conversations happen, how many turn into sales, and where shoppers drop off along the way.
The problem is that not every chatbot dashboard shows you what matters. Some bury the useful numbers under vanity metrics. Others track conversations but never connect them to revenue, which is the one thing a store owner actually cares about.
In this guide, we’ll explain what a chatbot analytics dashboard is, why it matters, what to look for when you choose one, and how to get a good one on WooCommerce. So, let’s get started!
Table of Contents
What Is A Chatbot Analytics Dashboard?
A chatbot analytics dashboard is a single screen that shows how your AI chatbot is performing. It reports how many conversations it handles, how many lead to a purchase, and where customers fall away, so you can read your chatbot’s impact at a glance instead of digging through transcripts.
Think of it as the control room for your AI chatbot. A good one pulls live data into clear metrics, charts, and a conversion funnel, then lets you filter by date range to compare this week, month, or quarter against the last.
The best ones go one step further and tie conversations to actual sales.
Why Does A Chatbot Analytics Dashboard Matter?
A chatbot analytics dashboard matters because it’s the only way to know if your AI chatbot is earning its keep. Without one, you’re guessing: you can see that the bot replies to people, but not whether those replies turn browsers into buyers.
The stakes are higher than they look. According to Baymard Institute’s research, the average online shopping cart abandonment rate sits at 70.22%, calculated across 50 separate studies. Most shoppers who start a journey never finish it, and a dashboard with a conversion funnel shows you the exact step where yours give up.
That visibility is what turns a chatbot from a support cost into a sales tool. When you can see that customers see the widget but rarely open it, or open it but rarely buy, you know where to focus.
💡 You can pair the dashboard data with your wider store numbers in WooCommerce’s own Analytics reports to get the full picture.
What Should You Look For In A Chatbot Analytics Dashboard?
Look for a chatbot analytics dashboard that connects conversations to revenue, shows a conversion funnel, updates in real time, and lets you compare date ranges.
Those four things separate a dashboard you’ll actually use from one you’ll open once and forget.
Revenue attribution, not just chat counts
Plenty of dashboards count conversations. Far fewer tell you how much money those conversations made you.
The most useful chatbot dashboard ties chats to assisted revenue and a close rate, so you can prove the bot’s value in dollars, not just activity.
A conversion funnel
A funnel maps the path from a shopper seeing the chat widget to opening it, adding to cart, and buying.
It’s the single most useful view on the dashboard, because it shows you exactly where customers drop off rather than leaving you to guess.
Real-time, filterable data
Your numbers should be live, not a day old, and you should be able to switch the time window quickly.

Switch between 7d, 30d, 90d, 12mo, and All at the top of the dashboard.
A date-range control with a “vs previous period” comparison tells you whether things are trending up or down, which is far more useful than a single static number.
Insights you can act on
Data is only useful if it points to a decision. The best dashboards add a plain-language briefing or a full report, so you don’t need to be an analyst to know what to do next. If a dashboard leaves you staring at charts with no idea what they mean, it isn’t doing its job.
Which Metrics Should a Chatbot Analytics Dashboard Track?
At a minimum, a chatbot analytics dashboard should track chat-assisted revenue, conversion rate, total chats, and widget impressions. Together these tell you how many people the bot reached, how many it helped, and what that was worth.
Those are the headline numbers, but they aren’t the whole story. It pairs well with this article: the metrics guide covers the numbers, and this one covers the dashboard that displays them.

For a deeper breakdown of what to measure and why, read our guide to the chatbot KPIs every WooCommerce store should track.
How To Get A Chatbot Analytics Dashboard On WooCommerce
If you run WooCommerce, the simplest way to get a chatbot analytics dashboard is StoreAgent, an AI chatbot for WooCommerce with the dashboard built in. There’s nothing extra to connect, and it’s available on every plan, including the free Lite plan.
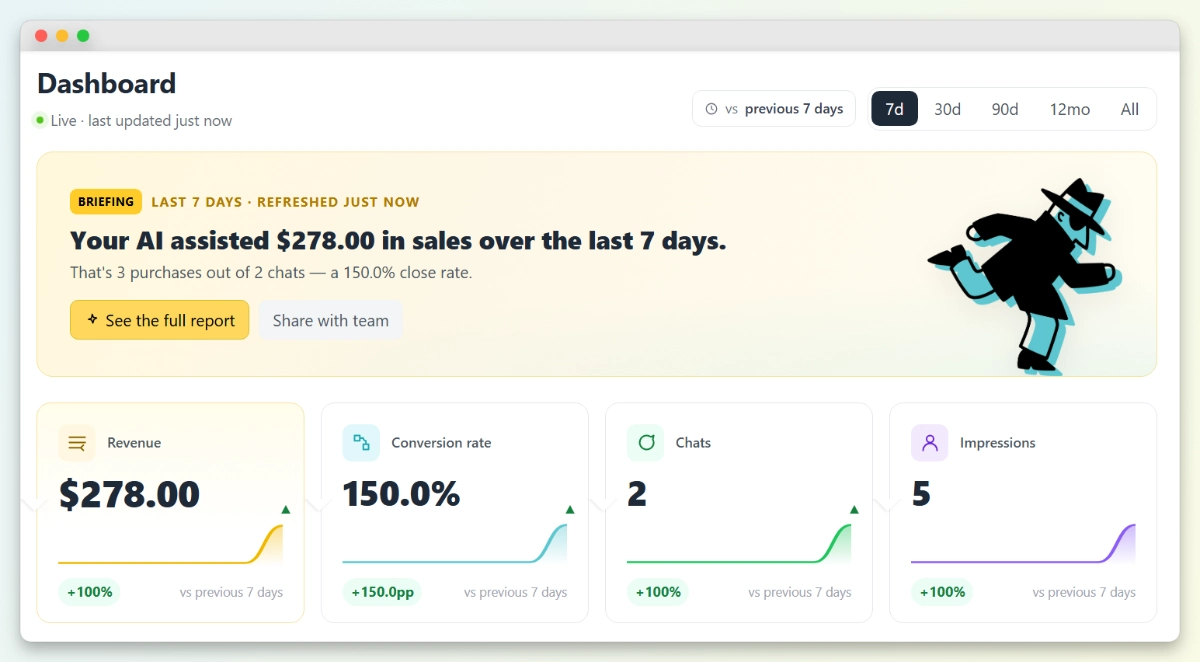
StoreAgent’s dashboard checks every box above. It opens with a plain-language briefing that summarizes your AI-assisted revenue and close rate, backed by four KPI cards: Revenue, Conversion rate, Chats, and Impressions, each with a sparkline and a “vs previous period” comparison.
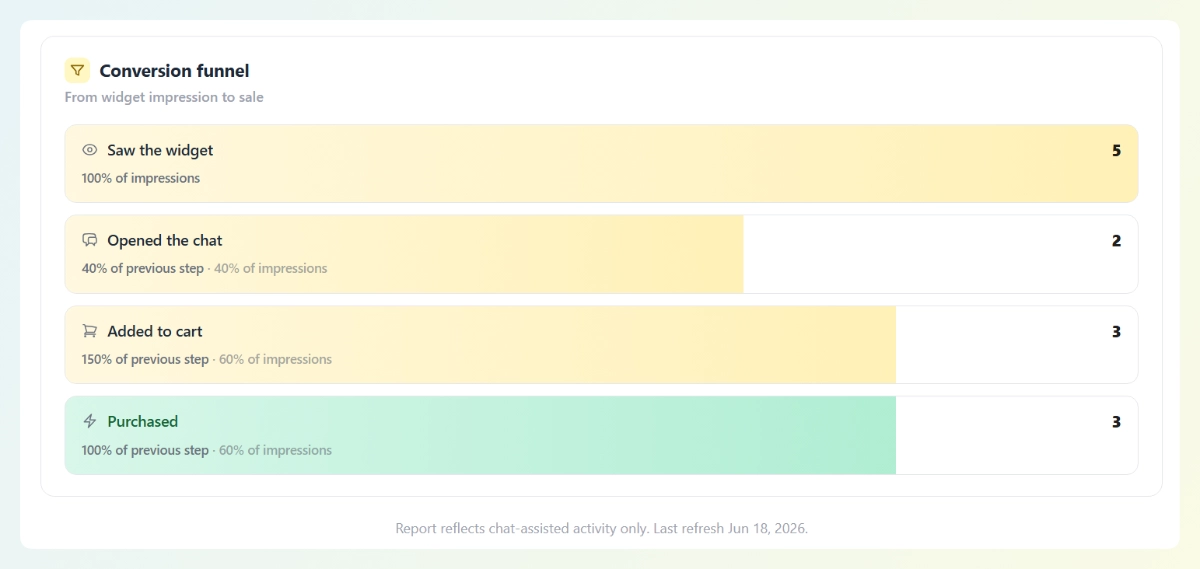
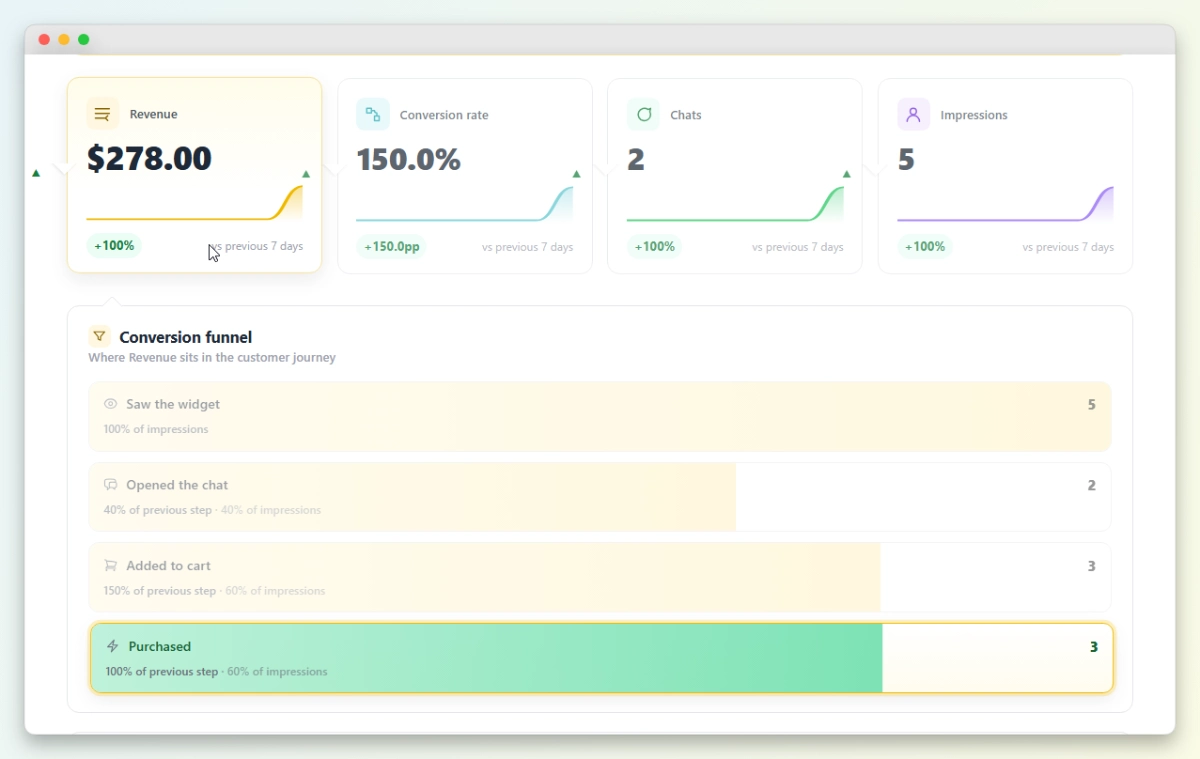
Hover any KPI and a conversion funnel reveals where shoppers drop off, from “Saw the widget” through “Opened the chat” and “Added to cart” to “Purchased.”
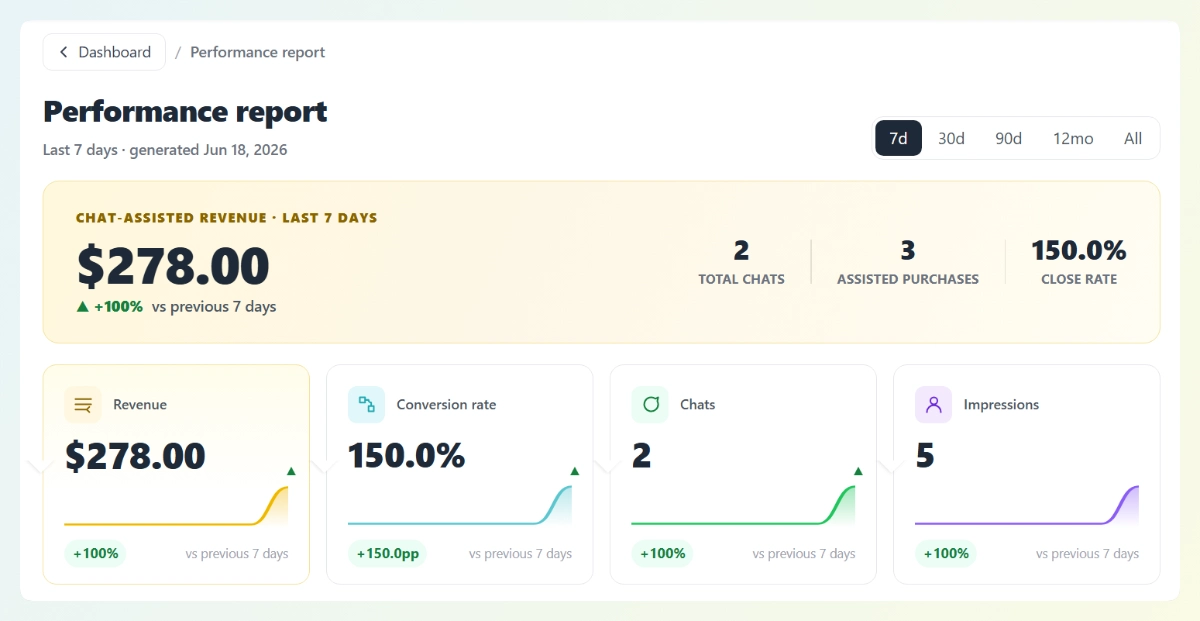
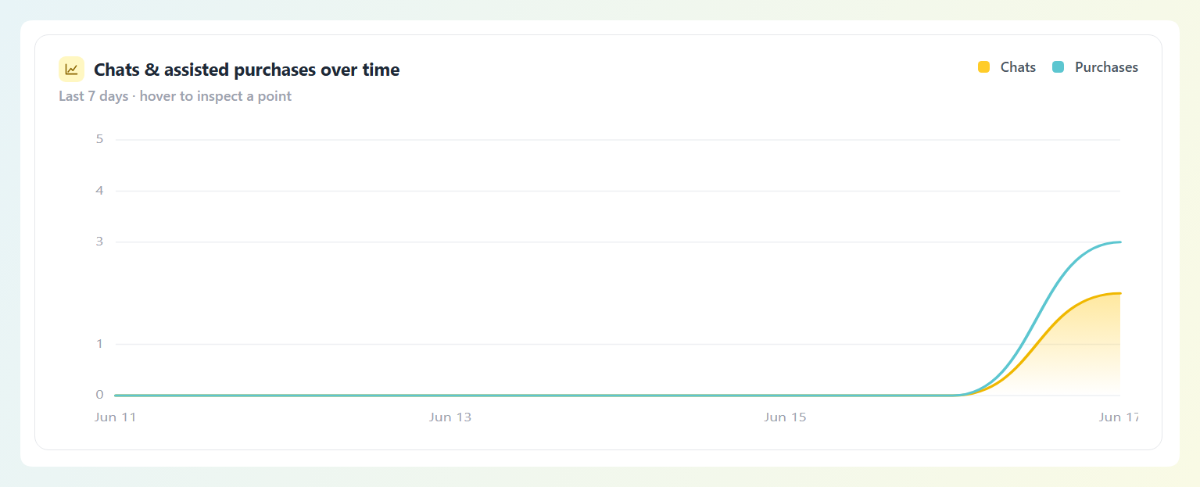
For the deeper view, the briefing’s full Performance report opens a standalone page with its own date filter (7d, 30d, 90d, 12mo, or All) and a chats-and-assisted-purchases-over-time chart.
Because it’s built specifically for WooCommerce, StoreAgent ties chats to real orders rather than estimating.
You can see how to use an AI chatbot to reduce cart abandonment at the exact funnel stage your dashboard flags, and learn more about the broader benefits of using AI chatbots on your store.
Conclusion
A chatbot analytics dashboard is what turns your AI chatbot from a black box into a measurable sales tool. The right one connects conversations to revenue, shows a conversion funnel, and tells you what to do next. Here’s a quick recap of what we covered:
- What a chatbot analytics dashboard is and why it matters
- The features to look for: revenue attribution, a conversion funnel, real-time filterable data, and actionable insights
- The core metrics it should track
- How to get one on WooCommerce with StoreAgent
If you’re ready to see your own chatbot analytics dashboard in action, explore our plans and pricing today and start on the free Lite plan.
Frequently Asked Questions
What is a chatbot analytics dashboard?
A chatbot analytics dashboard is a single screen that shows how your AI chatbot is performing, including how many conversations it handles, how many turn into sales, and where customers drop off. It turns raw chat data into metrics you can act on.
What should an AI chatbot dashboard track?
A good AI chatbot dashboard should track chat-assisted revenue, conversion rate, total chats, and widget impressions, plus a conversion funnel that shows where shoppers drop off. Connecting conversations to revenue is the most important feature, because it proves the bot’s value in dollars.
Does WooCommerce have a chatbot dashboard?
WooCommerce doesn’t include an AI chatbot by default, but plugins like StoreAgent add an AI chatbot with a built-in analytics dashboard. StoreAgent’s dashboard shows your KPIs, a conversion funnel, and a full performance report inside your WordPress admin.
Is there a free chatbot analytics dashboard?
Yes. StoreAgent includes its analytics dashboard on every plan, including the free Lite plan, so you can track your chatbot’s performance without paying for a separate analytics tool. Your KPIs and funnel fill in as your store gathers chat data.
How is a chatbot analytics dashboard different from chatbot metrics?
Chatbot metrics are the individual numbers you measure, like conversion rate or close rate. A chatbot analytics dashboard is the screen that displays those metrics together, with charts, a funnel, and date filters, so you can read them in context and act on them.